Research note · 30 August 2026
Does agentic-economy pricing lead the stock market?
Every day Agentery observes the public prices of roughly 17,000 AI agents and MCP services and compresses the genuine repricings — only like-for-like, same-plan-over-time comparisons — into one number: the Agentic Economy Price Index (AEPI). A new preliminary research note asks a bigger question of that number: do short-horizon moves in the AEPI show up before moves in public equity markets?
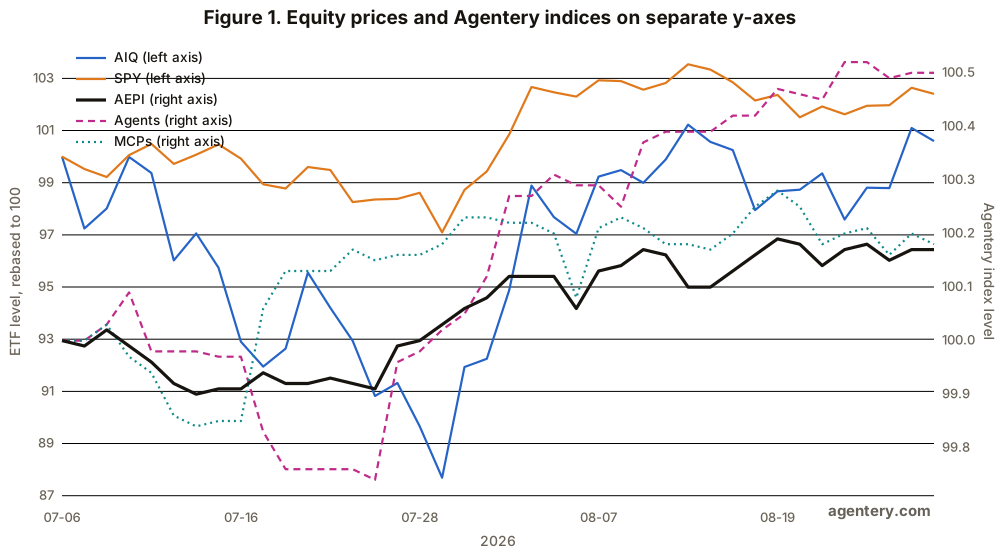
Read this first: the result is exploratory. It rests on eight weeks of index history, the horizons overlap, and the authors themselves label every p-value hypothesis-generating rather than confirmatory. Nothing here is investment advice.
The test, built to be hard on itself
The design is deliberately conservative. The signal is the AEPI’s percentage change over the three calendar days ending on trading day t. Then a full trading day is thrown away — no measured exposure at all — and only afterwards is the outcome measured: close-to-close returns in SPY (the S&P 500 ETF) and AIQ (an AI-focused ETF). Signal window and outcome window never overlap. The same test run in reverse — do prior equity returns predict the AEPI? — finds essentially nothing, which is the asymmetry you’d want to see if the index genuinely moves first.
What came out
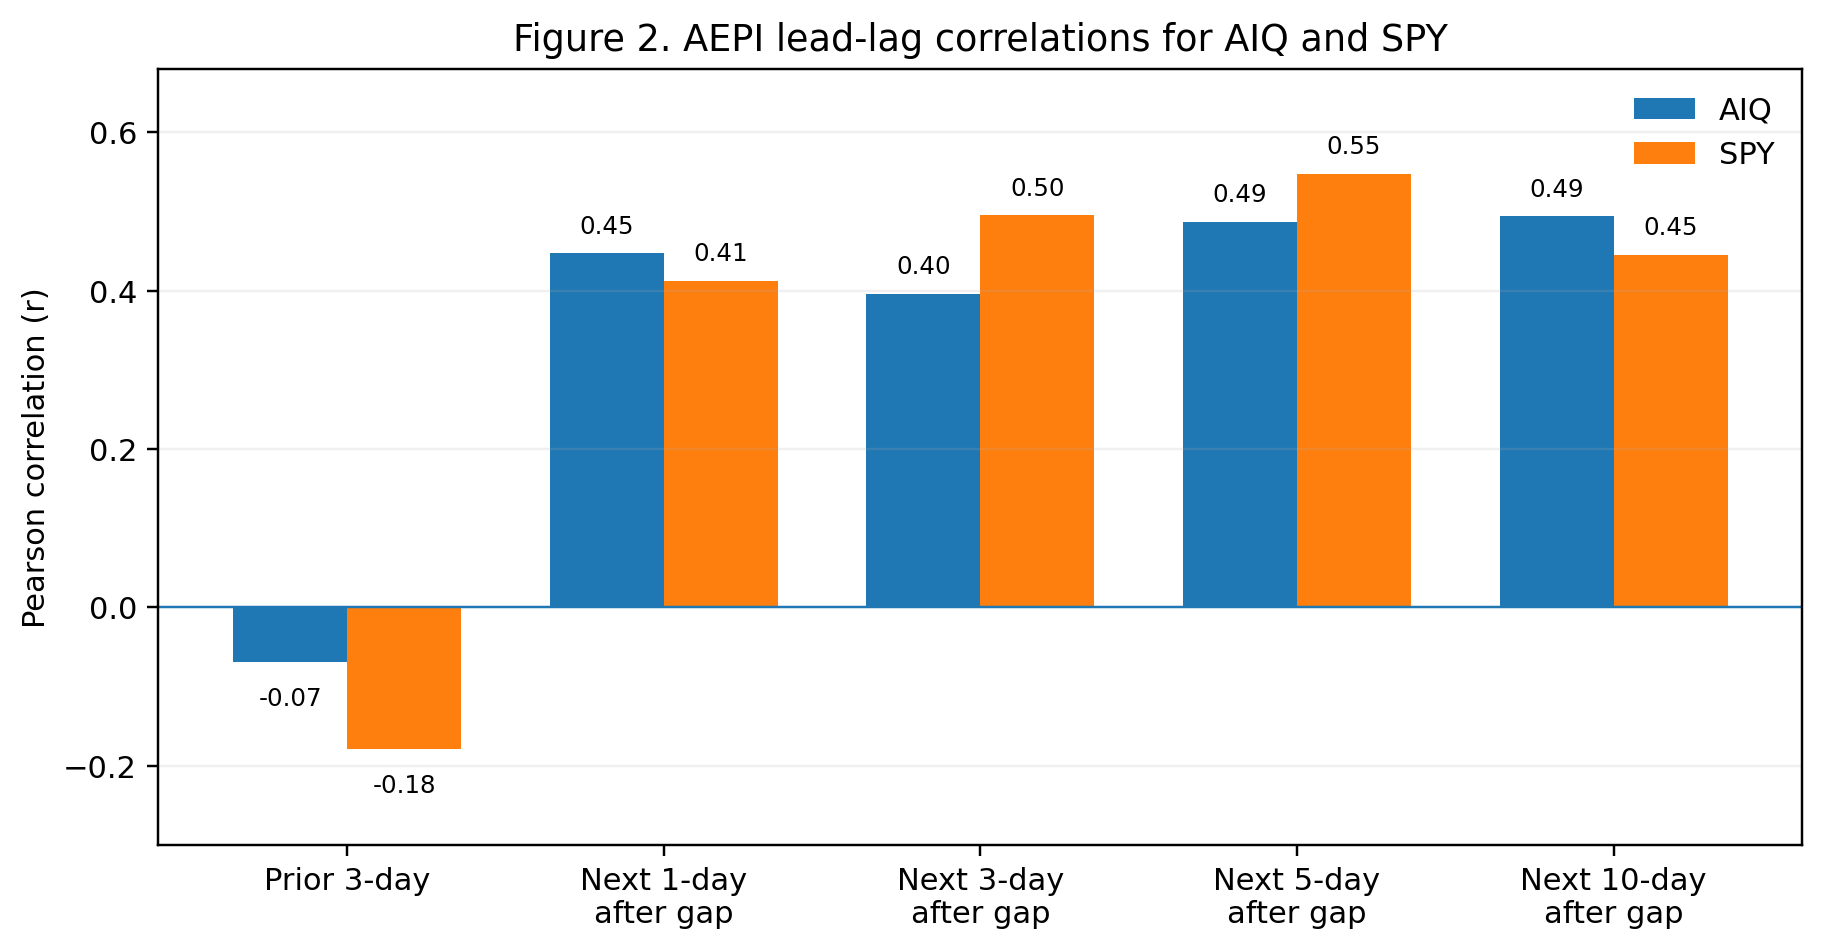
Correlations between the AEPI signal and future SPY returns:
| Signal | +1 day | +3 days | +5 days |
|---|---|---|---|
| AEPI (composite) | 0.41 | 0.50 | 0.55 |
| Agents only | 0.06 | 0.32 | 0.37 |
| MCPs only | 0.32 | 0.15 | 0.23 |
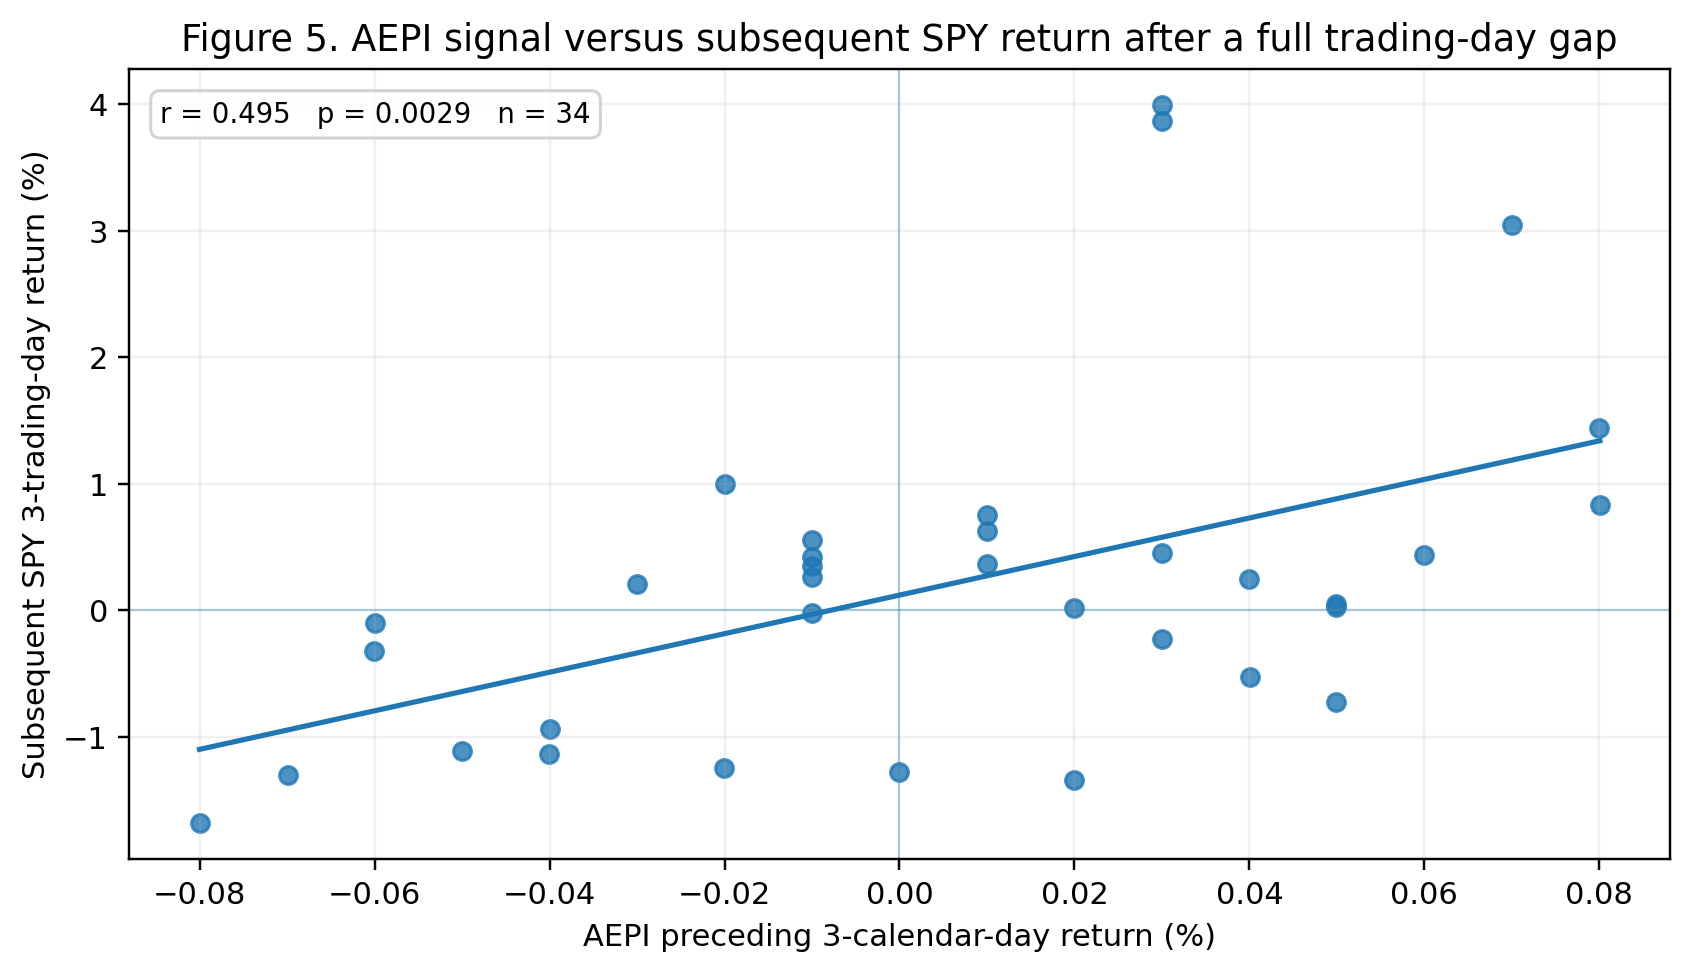
Three things stand out. First, the correlations are positive and moderately large at every short horizon — unusual for an eight-week alternative-data series. Second, the pattern holds for both the AI-specific ETF and the broad market, and once SPY is controlled for, the AEPI adds no separate AIQ-specific power — so the honest current interpretation is that the index may be picking up a broad market factor, not a niche AI signal. Third, and most interesting to us: the composite beats its own components. Neither the Agents series nor the MCPs series predicts as well alone as the blended index does — the signal appears to be a property of the whole agentic economy’s repricing behaviour, not of one segment.
Why this index is even a candidate
Most alternative data is noisy because it measures presentation, not economics. The AEPI was engineered the other way: a repricing only counts when the same plan of the same product is observed at two points in time with a different price. Page redesigns, plans appearing or vanishing, tier reshuffles and currency formatting can’t move it; buyer tiers are never blended; thin cohorts are flagged rather than smoothed. That discipline — built for honest price measurement — is exactly what makes the series clean enough to test against markets at all.
What happens next
The note pre-registers its own future: the signal definition is frozen as of now, every new day’s value is timestamped before markets move, and the test will be re-run once 100+ genuinely unseen trading days have accumulated — reported regardless of outcome. If the relationship survives out-of-sample, that’s worth taking seriously. If it doesn’t, we’ll say so on this blog.
Read the full research note (with all figures and tables) →
“Does the Agentic Economy Price Index Lead Public Equity Markets?” — B. Heaton, updated preliminary research note, 30 August 2026. Underlying index data: agentery.com/aepi, reproducible via the Agentery MCP (get_price_index_history).
Not investment advice. The AEPI is a chained observed-pricing index, not a market price or tradeable asset.