Update 14 October 2026: the SPY result in this note did not hold out of sample. A wider analysis points at growth and AI stocks instead. See the October update.
Preliminary research note, 30 August 2026. Exploratory — hypothesis-generating, pending prospective out-of-sample validation. Not investment advice. The AEPI is a chained observed-pricing index, not a market price or tradeable asset.
Does the Agentic Economy Price Index Lead Public Equity Markets?
Preliminary Lead-Lag Evidence from AEPI, its Agent and MCP Sub-indices, AIQ and SPY
Ben Heaton · OpenAI GPT-5.6
Updated preliminary research note · 30 August 2026
Abstract. This exploratory study tests whether short-horizon movements in the Agentic Economy Price Index (AEPI), and in its Agent and model-context-protocol (MCP) sub-indices, precede returns in public equities. AEPI is constructed from daily observation of public prices across approximately 17,000 listed agent and MCP services, using chained like-for-like comparisons designed to prevent page edits, changing availability or tier reclassification from generating spurious price moves; the platform also uses semantic representations of services to form capability-level neighbourhoods and pricing benchmarks. The principal conservative design measures each Agentery index over the preceding three calendar days through trading date t, leaves one complete trading day with no measured equity exposure, and then measures subsequent close-to-close returns in the Global X Artificial Intelligence & Technology ETF (AIQ) and the SPDR S&P 500 ETF Trust (SPY). The composite AEPI was positively correlated with later SPY returns at one, three and five trading-day horizons (r = 0.413, 0.495 and 0.548) and with later AIQ returns (r = 0.447, 0.396 and 0.487). Component decomposition did not reveal a stronger stable sub-index. At the same horizons, Agent correlations with SPY were 0.060, 0.317 and 0.374, while MCP correlations were 0.316, 0.151 and 0.227. The corresponding AIQ values were 0.062/0.277/0.436 for Agents and 0.373/0.084/0.084 for MCPs. Thus the composite generally outperformed either component on the principal short-horizon comparisons. AIQ and SPY future returns were themselves highly correlated, and AEPI did not retain significant incremental explanatory power for AIQ after the matching SPY return was included. The current evidence therefore favors a broader market-factor interpretation and suggests that the composite construction may capture information not reproduced by either sub-index alone. The sample remains short and all results are hypothesis-generating pending prospective validation. |
Keywords: agentic economy; alternative data; AEPI; agents; MCP; lead-lag; SPY; AIQ; equity returns; predictive signal
1. Introduction
Alternative economic data can be valuable when it captures changes in commercial activity before those changes are incorporated into liquid financial markets. AEPI is a daily price index intended to summarize pricing across the emerging agentic economy. The source dataset also reports standalone Agent and MCP series, each independently based at 100. This makes it possible to ask not only whether AEPI precedes equity returns, but whether any apparent predictive content is concentrated in one underlying market segment.
An initial analysis found a positive lead-lag relationship between AEPI and AIQ. Repeating the same test with SPY suggested the relationship may be broader than AI equities. The present update adds the missing decomposition: the same pre-specified three-calendar-day signal is calculated separately for AEPI, Agents and MCPs and tested against exactly the same future AIQ and SPY windows. No alternative component-specific lookback is selected, reducing the risk of finding a stronger sub-index merely through post-hoc optimization.
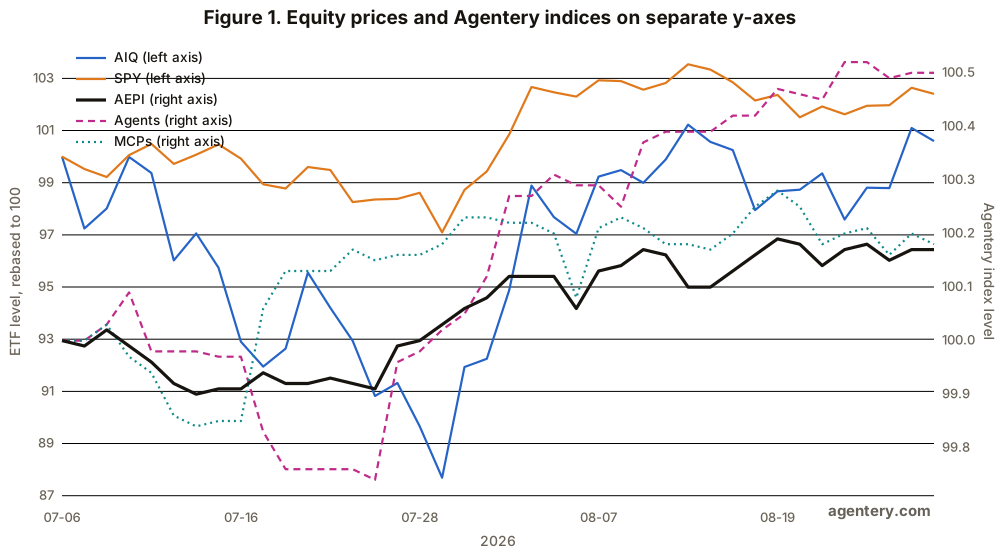
Figure 1 uses separate y-axes: AIQ and SPY are rebased to 100 on the left axis, while AEPI, Agents and MCPs retain their native index values on the right axis. Statistical tests use returns, not index levels.
2. Construction of AEPI and the Agentery Pricing Dataset
2.1 Daily observation of public prices
AEPI is built from the pricing layer maintained by Agentery. At the end-August 2026 snapshot, the public AEPI page reported 16,544 listings checked for prices every day; throughout this paper this is described as an approximately 17,000-service universe. The universe comprises commercial AI agents and MCP services. Prices are taken from providers' publicly available pricing information and parsed by Agentery rather than being self-reported by providers. The resulting dataset is published free on Agentery.com and is also exposed programmatically through the Agentery MCP interface.
2.2 Avoiding false repricing events
A central design problem is distinguishing a genuine economic price change from a change in the way a provider presents its pricing page. A page may alter wording, reveal or hide a price, rename a plan, change formatting, or move a plan between commercial tiers without changing the underlying economic price. AEPI therefore uses verified like-for-like observations rather than treating arbitrary text differences as repricing. Only services with comparable prices observed on both consecutive scan days contribute to that day's index movement. A newly observed or temporarily missing price does not itself move the index. Missing observations are represented as null and excluded rather than treated as zero.
Commercial buyer tiers are also kept separate. Agentery currently distinguishes Individual, Pro, Team / SME and Enterprise cohorts rather than blending them into a single benchmark. This reduces the risk that a shift in the mix of plans or a reclassification of a plan between market segments is mistaken for inflation or deflation. Public methodology also describes currency normalization, unit matching and provider de-duplication in the pricing engine, with thin cohorts flagged rather than smoothed into apparently precise estimates.
2.3 Chained like-for-like index construction
The headline AEPI is a chained like-for-like price index. For each consecutive pair of scan days, the engine compares matched services and calculates the geometric mean of their observed price ratios; these daily movements are then chained into an index rebased to 100. Agent and MCP facets are maintained as standalone series on their own base 100. This construction is specifically intended to measure genuine repricing among continuing comparable services while limiting composition effects caused by services entering or leaving the observed-price set.
2.4 Semantic market structure and local price intelligence
The Agentery dataset is not limited to a single aggregate price index. Services are semantically represented so that products performing similar economic activities can be located by meaning rather than only by a fixed category label. This creates local neighbourhoods of near substitutes. Agentery can therefore estimate the going rate for a capability, identify where comparable services are dense or sparse, and monitor which capability neighbourhoods are rising or falling in price. The semantic layer is analytically distinct from the headline AEPI: AEPI summarizes broad like-for-like repricing, while semantic neighbourhoods support activity-level price discovery and benchmarking.
2.5 Economic purpose
At the present stage of the agentic economy, this information primarily helps agent and MCP developers understand what comparable services charge and where their own pricing sits relative to nearby substitutes. The longer-run use case is potentially more consequential. If consumer and enterprise agents increasingly purchase other agents, tools and MCP-mediated services autonomously, they will require machine-readable information about which service to buy, from whom, and at what price. A continuously observed pricing layer could then function as market infrastructure for automated procurement as well as a source of economic measurement.
3. Data and Methods
3.1 Data
The supplied Agentery file contains daily AEPI, Agent and MCP values from 5 July through 30 August 2026. The file states that AEPI represents the whole agentic economy and that Agents and MCPs are standalone series, each on its own base 100 and not additive to the AEPI column. AIQ and SPY daily closing prices were aligned to the Agentery series on U.S. equity trading dates through 28 August 2026.
3.2 Predictive timing specification
For each trading date t, the explanatory variable is the percentage change in the relevant Agentery index—AEPI, Agents or MCPs—over the preceding three calendar days, ending on t. The commercially conservative specification discards the equity return from t to the next trading close. The measured outcome begins at that next close. Thus a one-day outcome is measured from the t+1 close to the t+2 close; a three-day outcome runs from t+1 to t+4; and so on. The Agentery return interval therefore ends before the measured equity return begins, with no overlap between explanatory and outcome return periods.
3.3 Statistical analysis
Pearson correlation is the principal effect-size measure, with Spearman correlation as a rank-based check. Conventional two-sided p-values, Fisher-transformed confidence intervals, Newey-West heteroskedasticity-and-autocorrelation-consistent (HAC) inference and exact circular-shift tests were calculated. Component tests deliberately retain the same three-calendar-day signal definition used for AEPI. Because the sample is short, outcomes overlap at horizons longer than one day, and several horizons and components are examined, p-values are exploratory rather than confirmatory.
4. Results
4.1 AEPI benchmark result
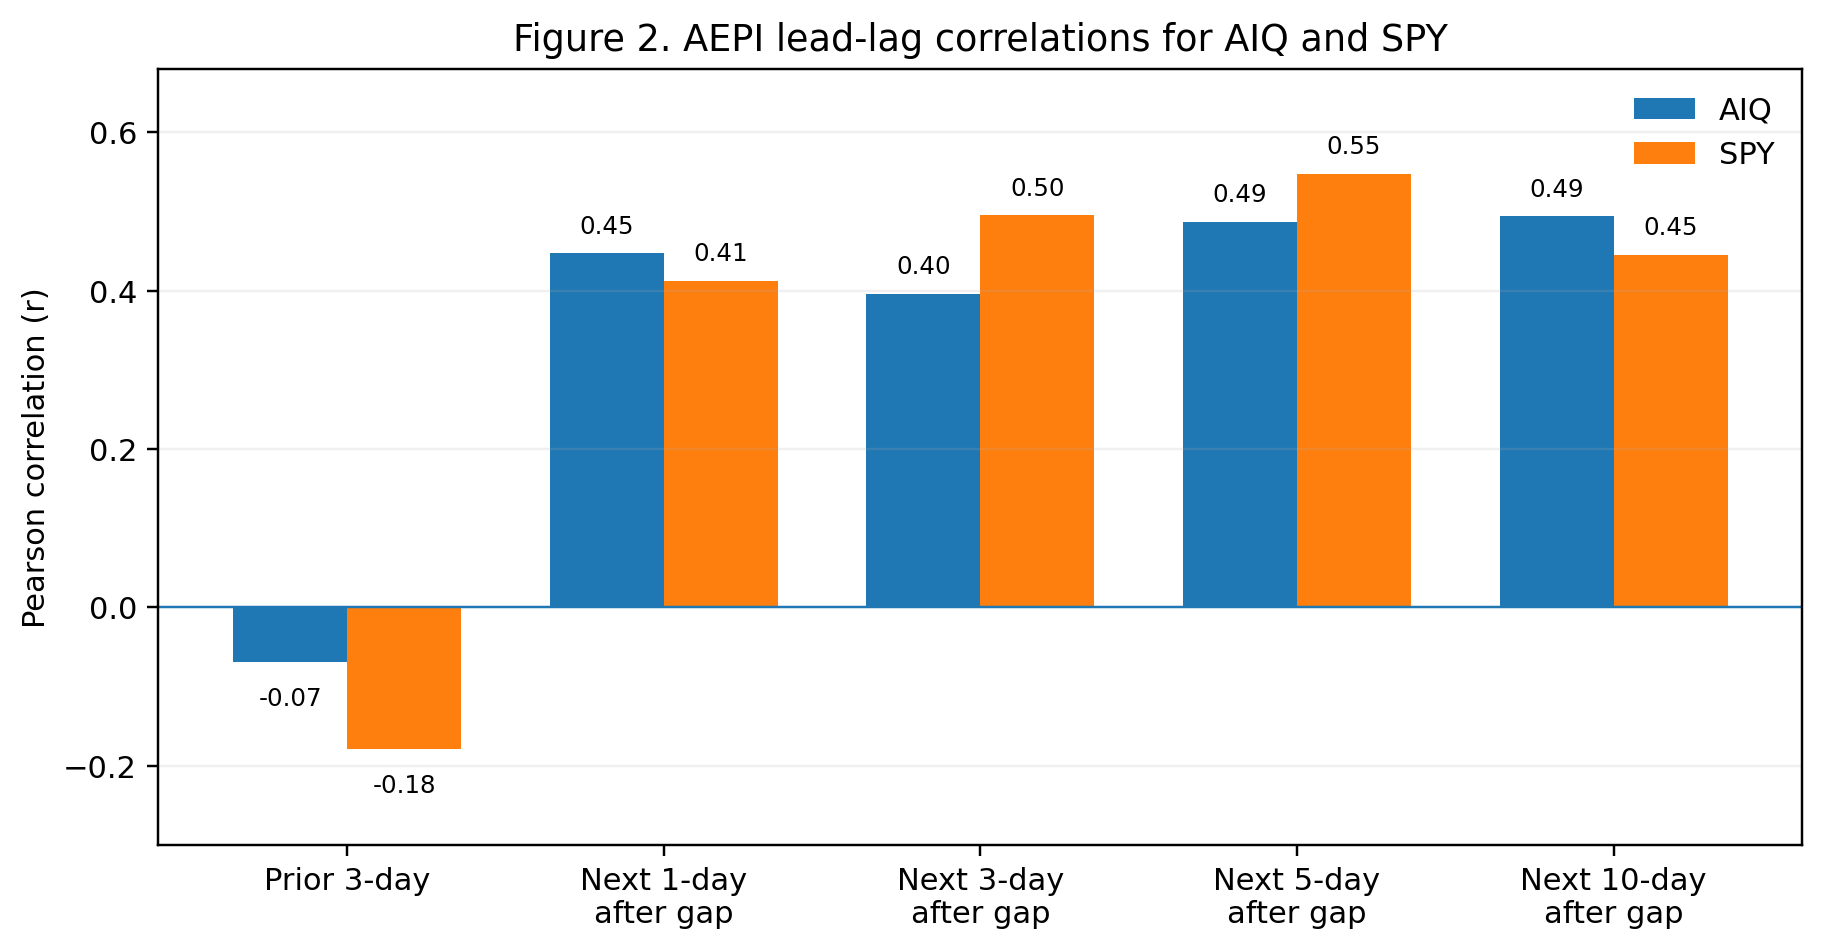
The temporal pattern remains asymmetric. Prior three-trading-day returns were weakly related to the subsequent AEPI signal for AIQ (r = -0.069, p=0.684) and SPY (r = -0.179, p=0.288), whereas the earlier AEPI signal was positively related to future returns. Under the full-trading-day-gap design, AEPI correlations with future SPY returns were 0.413, 0.495, 0.548 and 0.446 at one, three, five and ten trading days. The corresponding AIQ correlations were 0.447, 0.396, 0.487 and 0.494.
4.2 Do Agents or MCPs predict better than the composite?
No consistent component-level improvement was found. On the principal one-, three- and five-day horizons, the composite AEPI had the largest absolute correlation in five of the six asset-horizon comparisons and was effectively tied but still numerically higher in the sixth. For SPY, the mean absolute correlation across these three short horizons was 0.485 for AEPI, compared with 0.250 for Agents and 0.231 for MCPs. For AIQ the corresponding values were 0.443, 0.258 and 0.180.
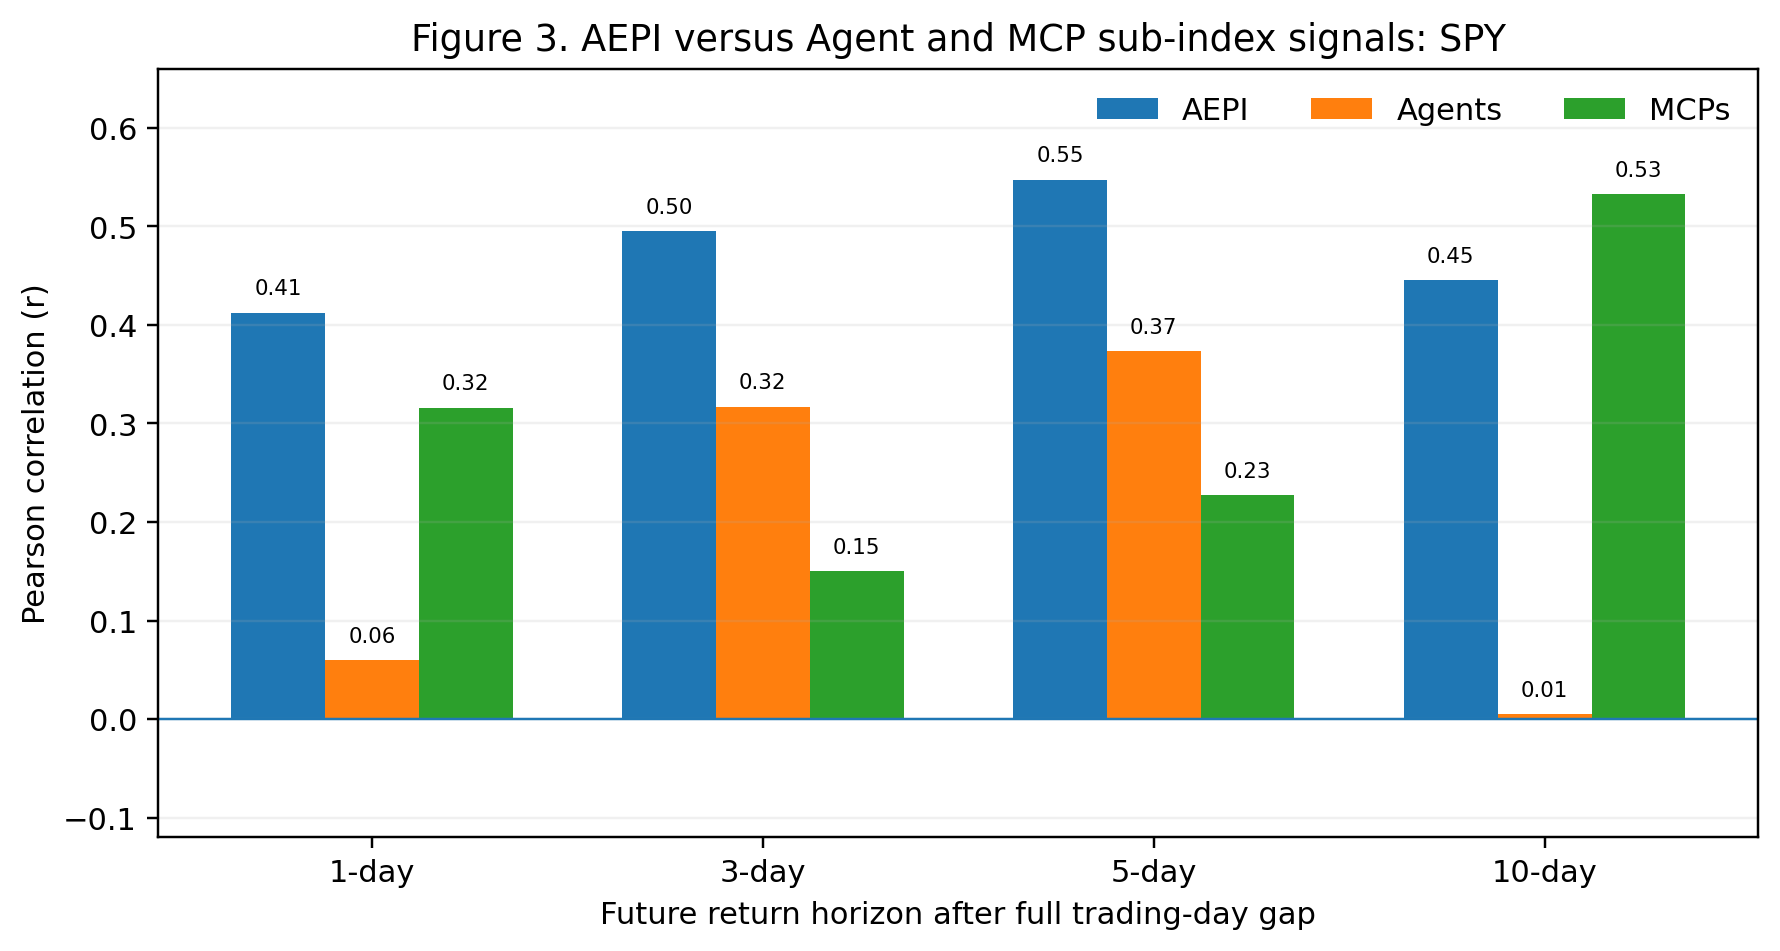
SPY component comparison:
Signal | 1-day r (p) | 3-day r (p) | 5-day r (p) | 10-day r (p) |
AEPI | 0.413 (0.012) | 0.495 (0.003) | 0.548 (0.001) | 0.446 (0.020) |
Agents | 0.060 (0.729) | 0.317 (0.068) | 0.374 (0.035) | 0.005 (0.979) |
MCPs | 0.316 (0.060) | 0.151 (0.396) | 0.227 (0.211) | 0.533 (0.004) |
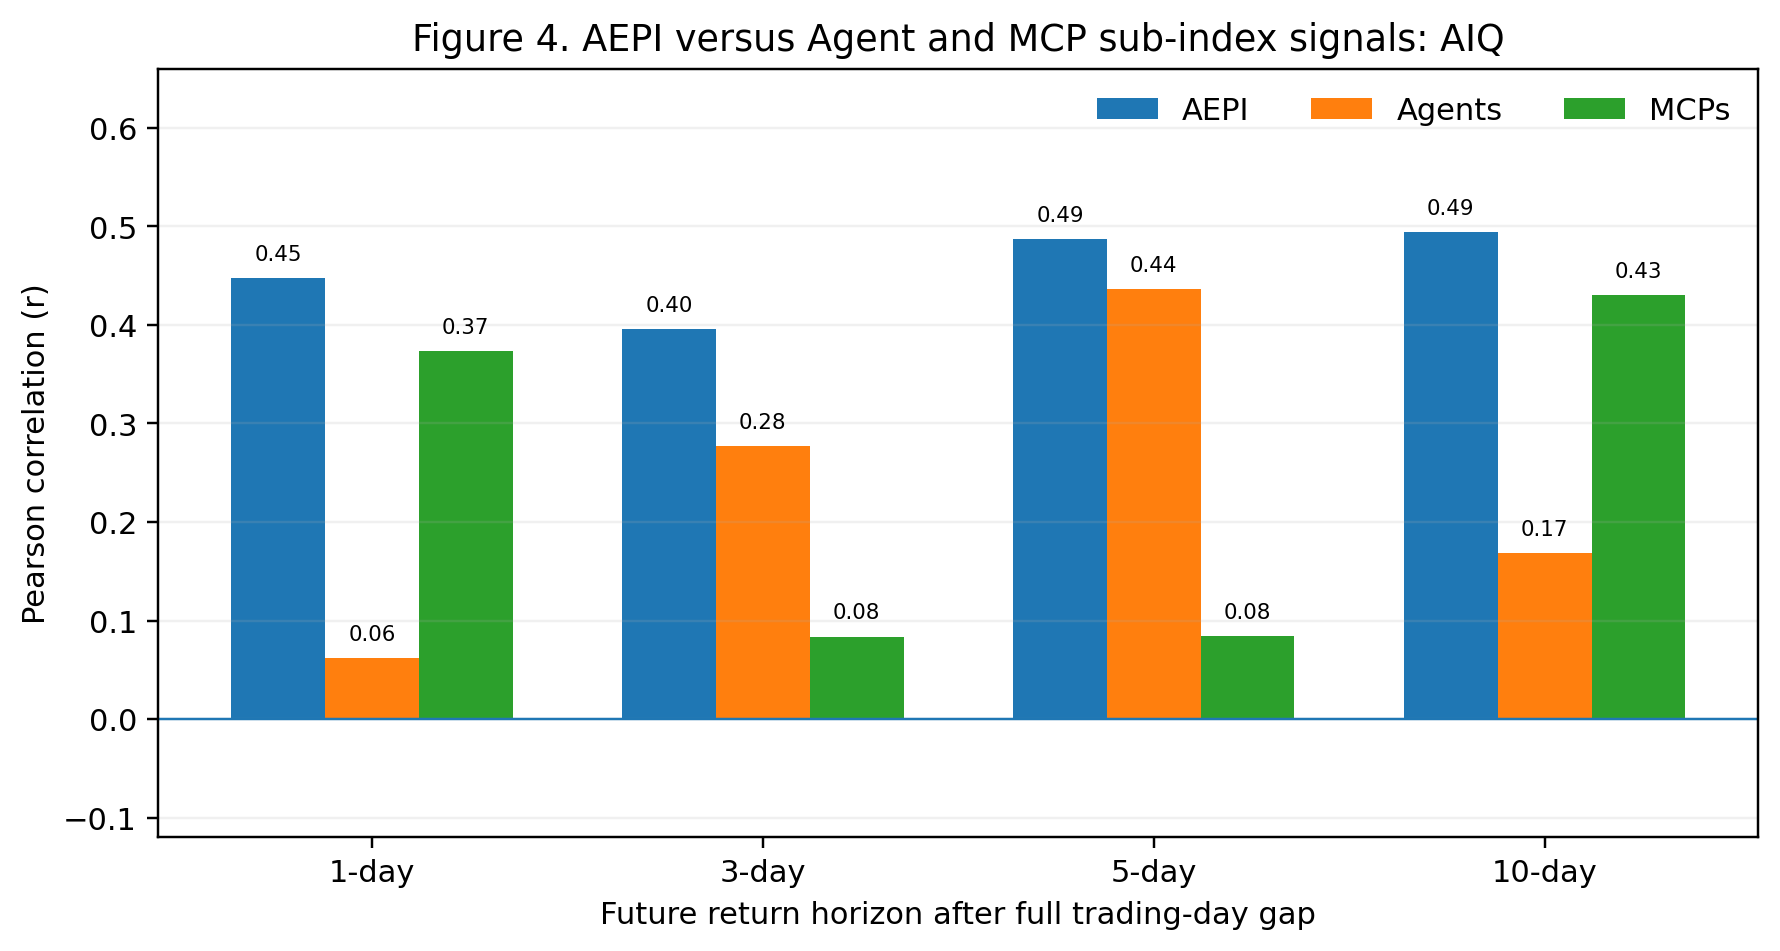
AIQ shows the same broad ordering. The AEPI signal is clearly stronger than Agents at one day and stronger than MCPs at three and five days. MCPs do show a meaningful one-day AIQ association (r = 0.373, conventional p=0.025; HAC p=0.0041; circular-shift p=0.028), but even there the composite AEPI correlation is larger (r = 0.447). Agents become more correlated with AIQ at five days (r = 0.436), again slightly below AEPI (r = 0.487).
Signal | 1-day r (p) | 3-day r (p) | 5-day r (p) | 10-day r (p) |
AEPI | 0.447 (0.006) | 0.396 (0.020) | 0.487 (0.005) | 0.494 (0.009) |
Agents | 0.062 (0.718) | 0.277 (0.113) | 0.436 (0.013) | 0.169 (0.401) |
MCPs | 0.373 (0.025) | 0.084 (0.637) | 0.084 (0.647) | 0.430 (0.025) |
The isolated ten-day MCP result is notable but should be treated cautiously. MCPs correlate with the later ten-day SPY return at r = 0.533 (p=0.0042; circular-shift p=0.037) and with AIQ at r = 0.430 (p=0.0252). This horizon has only 27 usable observations and extensive overlap between successive outcome windows; moreover it emerged from an exploratory multi-horizon comparison. It is therefore a hypothesis for future testing, not evidence that MCP pricing is the dominant signal.
A two-predictor model using Agent and MCP changes separately also did not systematically improve on the composite. At the SPY three- and five-day horizons, the two-component model explained 15.1% and 24.2% of outcome variance, compared with 24.5% and 30.0% for AEPI alone. For AIQ the corresponding comparisons were 9.8% versus 15.7% at three days and 22.6% versus 23.7% at five days. This descriptive result suggests that AEPI may combine component movements in a way that is more informative than simply entering the two sub-index returns as separate linear predictors.
4.3 Significance of the principal SPY result
For SPY, the one-day outcome after the full trading-day gap produced r = 0.413 (n=36, p=0.0124; HAC p=0.0400; circular-shift p=0.056). The three-day outcome was r = 0.495 (p=0.0029; HAC p=0.0011; circular p=0.088), and the five-day outcome was r = 0.548 (p=0.0012; HAC p=0.0019; circular p=0.031). The circular-shift result is strongest at five days, but because horizons were examined retrospectively it should not be interpreted as a pre-registered confirmatory p-value.
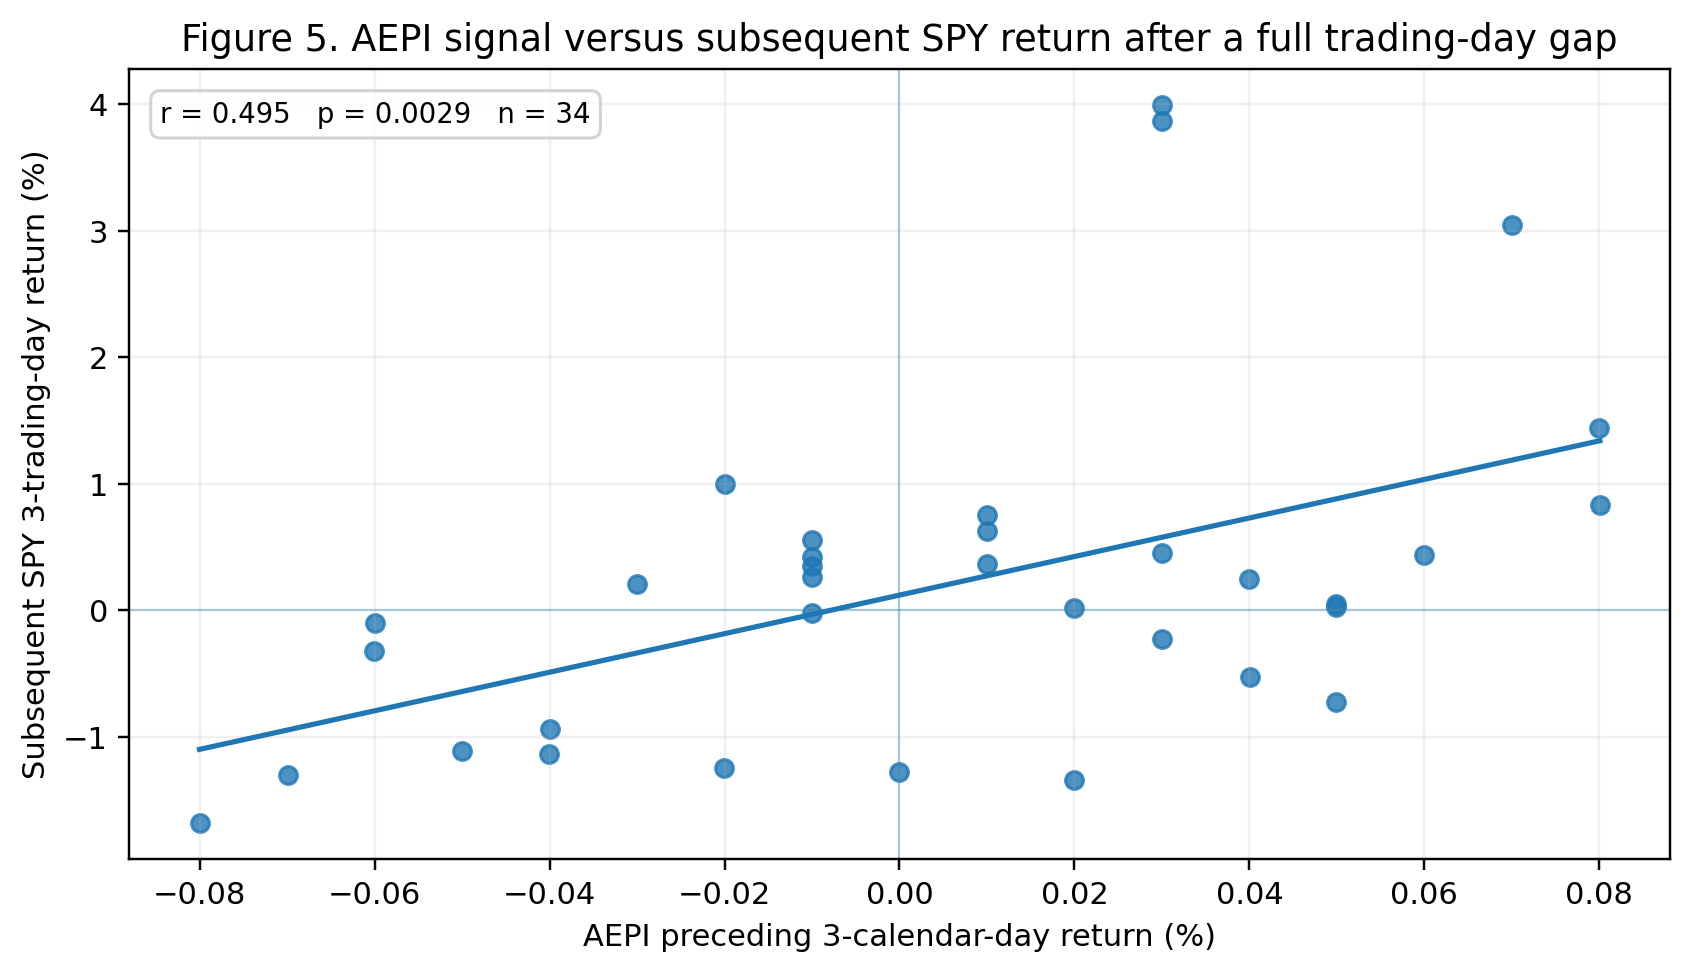
For the three-day SPY outcome, a positive AEPI signal was followed by an average SPY return of +0.74%, versus -0.40% after a flat or negative AEPI signal. The directional sign agreed in 70.6% of observations. These figures are descriptive and are not a trading backtest.
4.4 Is the effect specific to AIQ?
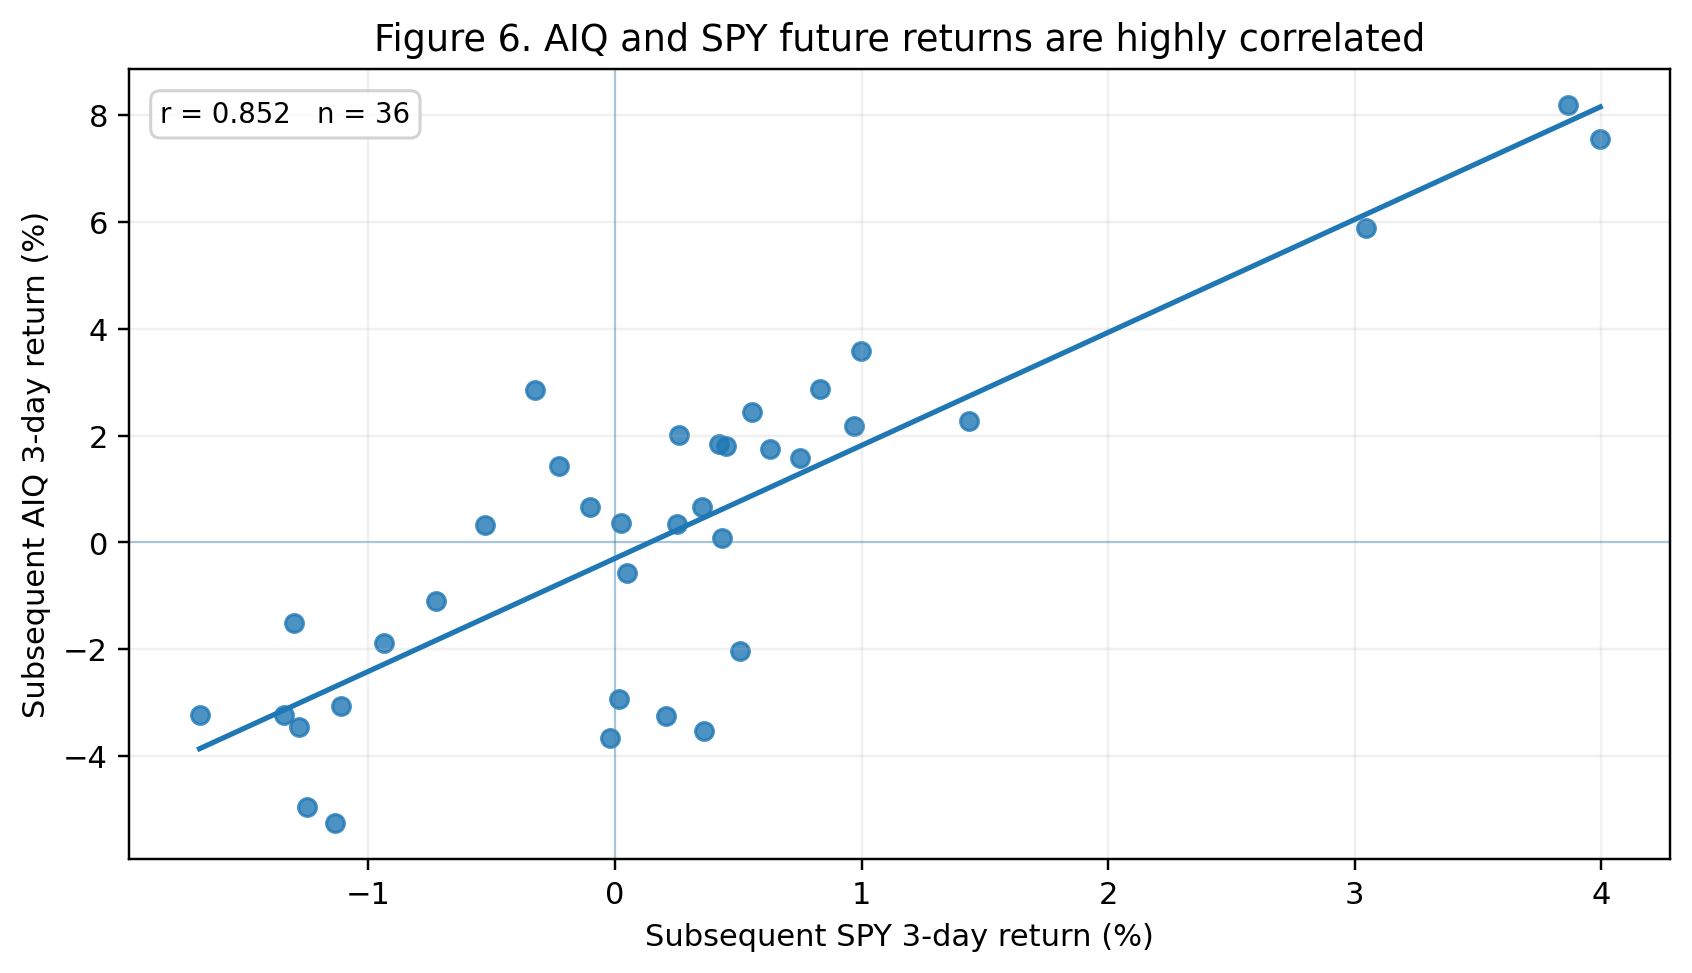
The benchmark analysis still argues against an AIQ-specific interpretation. Subsequent AIQ and SPY returns were highly correlated over the same forecast windows: r = 0.802 at one day, 0.852 at three days and 0.894 at five days. Once the matching SPY return is included in a regression predicting AIQ, the incremental AEPI term is not statistically significant (HAC p=0.168, 0.654 and 0.967 respectively).
5. Interpretation and Potential Significance
The component analysis strengthens one aspect of the original result. If the apparent predictive relationship had been driven almost entirely by one sub-index, the broader AEPI result could have been an incidental consequence of that component. Instead, neither Agents nor MCPs reproduces the composite’s consistent short-horizon strength. Across the principal one-, three- and five-day horizons, AEPI is the strongest signal against both SPY and AIQ overall. This is consistent with, though does not prove, the idea that information is distributed across the agentic economy and that the composite index aggregates it more effectively than either segment alone.
The finding also remains broader than AI equities. Since AIQ and SPY future returns move closely together and AEPI loses incremental significance for AIQ after controlling for SPY, the most defensible current interpretation is that AEPI may be associated with a broader U.S. equity, technology-sensitive or risk-appetite factor. Commercial pricing and demand conditions in the agentic economy could conceivably adjust before those conditions are fully reflected in public equity prices, but this dataset cannot identify the mechanism. It provides no basis for claims about insiders, portfolio rebalancing or causal transmission.
The construction of AEPI offers a plausible reason to take the result seriously as alternative economic data. The index is derived from thousands of observed commercial price relationships rather than from equity prices, market sentiment or financial-market inputs. Its semantic layer additionally allows changes to be localized to economically similar services. A persistent lead over public equities would therefore suggest that repricing within a rapidly changing technology market contains information not yet fully incorporated into liquid securities. This remains a hypothesis about information timing, not evidence of a particular causal channel or of insider trading behaviour.
If the relationship survives prospective testing, the potential commercial value is substantial because SPY is extremely liquid and easy to benchmark. The more immediate scientific value is that AEPI appears to contain a coherent signal that is not obviously reducible to one of its published sub-indices. Separately, the same dataset has an operational market role: it can inform providers what to charge today and, as autonomous purchasing scales, could inform buying agents what to buy and at what observed market price.
6. Limitations
- Short sample: only about eight weeks of overlapping Agentery and U.S. equity history are available, yielding roughly 32-36 observations for the principal conservative tests.
- Multiple exploratory tests: two assets, three Agentery indices and several forecast horizons were inspected. Nominal p-values therefore overstate confirmatory evidence.
- Serial dependence: three-calendar-day Agentery signals overlap across successive dates, and multi-day equity outcomes overlap for horizons longer than one day. HAC inference and circular shifts only partially address this.
- Index evolution and reproducibility: the public methodology specifies a chained like-for-like geometric-mean construction, but the underlying service universe, parser, commercial-form classifier, semantic representations and eligibility rules may evolve as Agentery develops. Prospective financial testing should therefore record the engine/version, constituent eligibility and immutable daily publication timestamps so that historical signals cannot be altered by later methodology changes.
- Timestamp and execution integrity: a tradable study requires immutable publication timestamps and a pre-specified executable price such as the next market open.
- Benchmark interpretation: SPY is broad but technology-heavy by capitalization. Future controls should include QQQ, equal-weighted S&P 500, sector ETFs, rates and volatility.
- No causal identification and no net-profit simulation: the study establishes association only and does not model transaction costs, slippage, taxes, leverage or drawdowns.
7. Prospective Validation Protocol
The primary prospective signal should remain the composite AEPI three-calendar-day percentage change through date t. Record an immutable AEPI timestamp, preserve the full one-trading-day separation, and use the subsequent one-day SPY close-to-close return as the primary endpoint because it avoids overlapping equity outcome windows. Three- and five-day SPY returns should be secondary endpoints. AIQ should remain a secondary asset and should continue to be evaluated after controlling for SPY.
The Agent and MCP sub-index tests should also be frozen now as secondary explanatory variables using the same three-calendar-day lookback. The isolated ten-day MCP relationship should be labelled exploratory and tested prospectively without further tuning. Reporting all observations regardless of outcome is essential. With 100+ genuinely unseen trading observations, it will become possible to judge whether the composite’s apparent advantage over its components is stable rather than a feature of this initial sample.
8. Conclusion
The expanded analysis finds preliminary evidence that AEPI movements precede both AIQ and broad U.S. equity returns represented by SPY. AEPI is unusual as a candidate alternative-data signal because it is built from daily, verified, like-for-like public pricing across an approximately 17,000-service agentic-economy universe, while semantic neighbourhoods provide a separate view of local substitute markets and their price direction. Decomposing AEPI into its published Agent and MCP sub-indices does not reveal a stronger stable short-horizon predictor. On the principal one-, three- and five-day forecasts, the composite AEPI generally produces materially larger correlations than either component, while a separate Agent-plus-MCP regression does not consistently improve explanatory power. The result therefore appears to be a property of the composite signal rather than an obvious single-component effect. Together with the SPY benchmark finding, the most defensible current interpretation is that AEPI may capture short-horizon information related to a broader equity-market factor. The evidence is potentially commercially important but remains exploratory until prospectively timestamped, out-of-sample data accumulate.
References
1. Agentery. AEPI Index — Table of Values. Generated 30 August 2026; engine aepi-ledger-v1. Daily AEPI, Agent and MCP history from 5 July 2026.
2. Agentery. AEPI — AI Agent Pricing Index. Public index page and daily repricing feed. Accessed 30 August 2026. https://www.agentery.com/aepi
3. Agentery. Agentery MCP — Market intelligence for agents. Methodology and tool documentation: daily public-price observation, chained like-for-like index construction, buyer tiers, semantic neighbourhoods and MCP access. Accessed 30 August 2026. https://agentery.com/docs
4. Agentery. Changelog. Pricing-engine notes including per-tier cohorts, currency normalization, unit matching, provider de-duplication and Agent/MCP facets. Accessed 30 August 2026. https://www.agentery.com/changelog
5. StockAnalysis. AIQ Historical Stock Price Data. U.S.-listed Global X Artificial Intelligence & Technology ETF. Accessed 30 August 2026. https://stockanalysis.com/etf/aiq/history/
6. StockAnalysis. SPY Historical Stock Price Data. State Street SPDR S&P 500 ETF Trust. Accessed 30 August 2026. https://stockanalysis.com/etf/spy/history/
7. Global X. Artificial Intelligence & Technology ETF (AIQ): ETF summary and objective. Accessed 30 August 2026. https://www.globalxetfs.com/funds/aiq
8. State Street Global Advisors. State Street SPDR S&P 500 ETF Trust (SPY): fund objective and benchmark. Accessed 30 August 2026. https://www.ssga.com/us/en/individual/etfs/state-street-spdr-sp-500-etf-trust-spy
9. Newey WK, West KD. A Simple, Positive Semi-definite, Heteroskedasticity and Autocorrelation Consistent Covariance Matrix. Econometrica. 1987;55(3):703-708.
Data and reproducibility note. Calculations use the supplied Agentery AEPI/Agent/MCP daily series, the previously compiled AIQ closes and SPY closing prices used in the benchmark analysis. Index-construction description is based on the Agentery public AEPI page and methodology documentation together with the methodology description supplied by the index creator. The complete merged component-analysis dataset is retained as a CSV alongside the working analysis.