Market note · 3 September 2026
Three records, one signal
Something unusual happened in today’s scan. Not one index but three closed at all-time highs on the same day: the headline AEPI at 100.28, the Agents index at 100.57, and the MCPs index at 100.29. Today’s headline gain — +0.06% in a single day, off 6,715 like-for-like pairs — ties for the second-largest daily rise since records began in July. And it’s the second record close in a row.
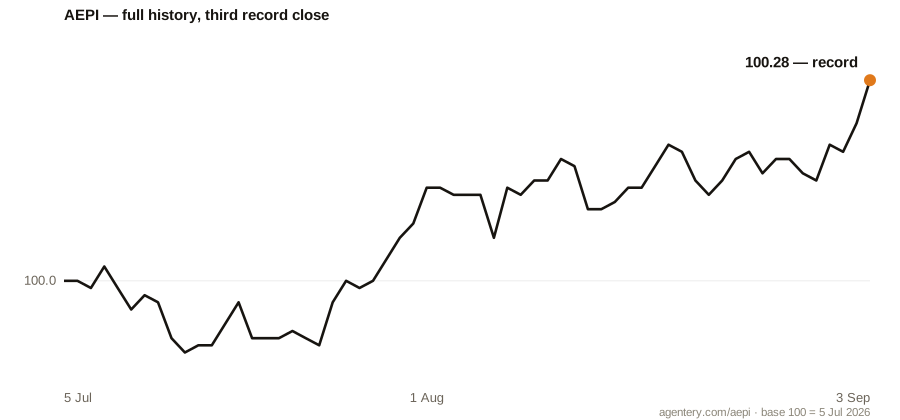
Both engines firing at once
What makes today different from Monday’s record is breadth. The 2 September high was carried by a handful of big repricings against a flat market. Today the two largest slices of the economy — single-purpose agents and MCP services — printed records together, something they had never done on the same day:
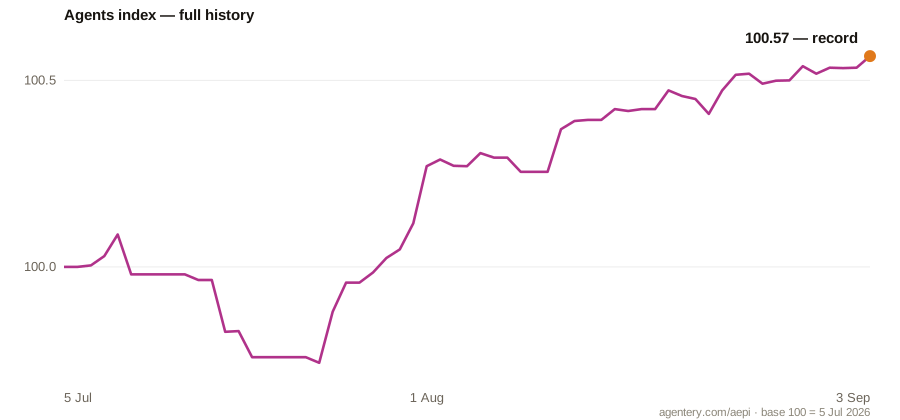
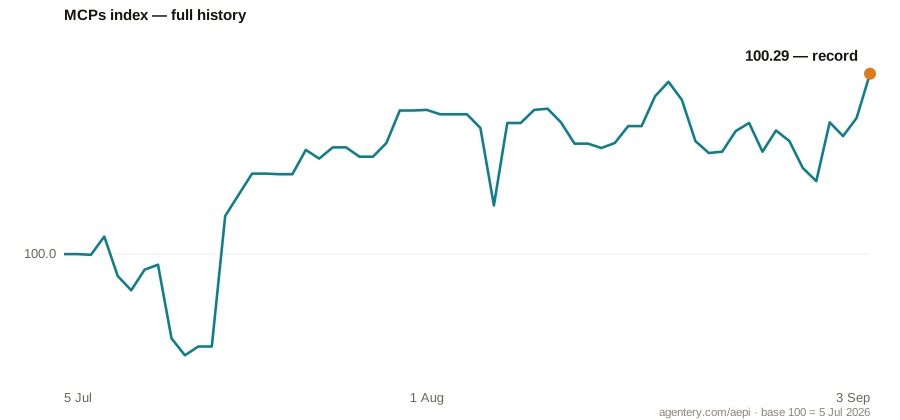
The one holdout remains Platforms, still near its record low at 99.18 despite a small bounce today — the price war at the platform layer hasn’t ended just because everything above it is firming.
The signal
Here is where it gets interesting. Our research note tested one specific quantity — the AEPI’s 3-day change — against what public equity markets did afterwards, with a full trading day deliberately skipped between signal and outcome. Over the study window, that signal was positively correlated with subsequent moves in SPY (r ≈ 0.5) and AIQ, and the reverse test (equities predicting the AEPI) found nothing — the asymmetry you’d want if agentic pricing genuinely moves first.
Today that 3-day signal reads +0.09% — the second-strongest reading ever recorded, a whisker from the 1 August record:
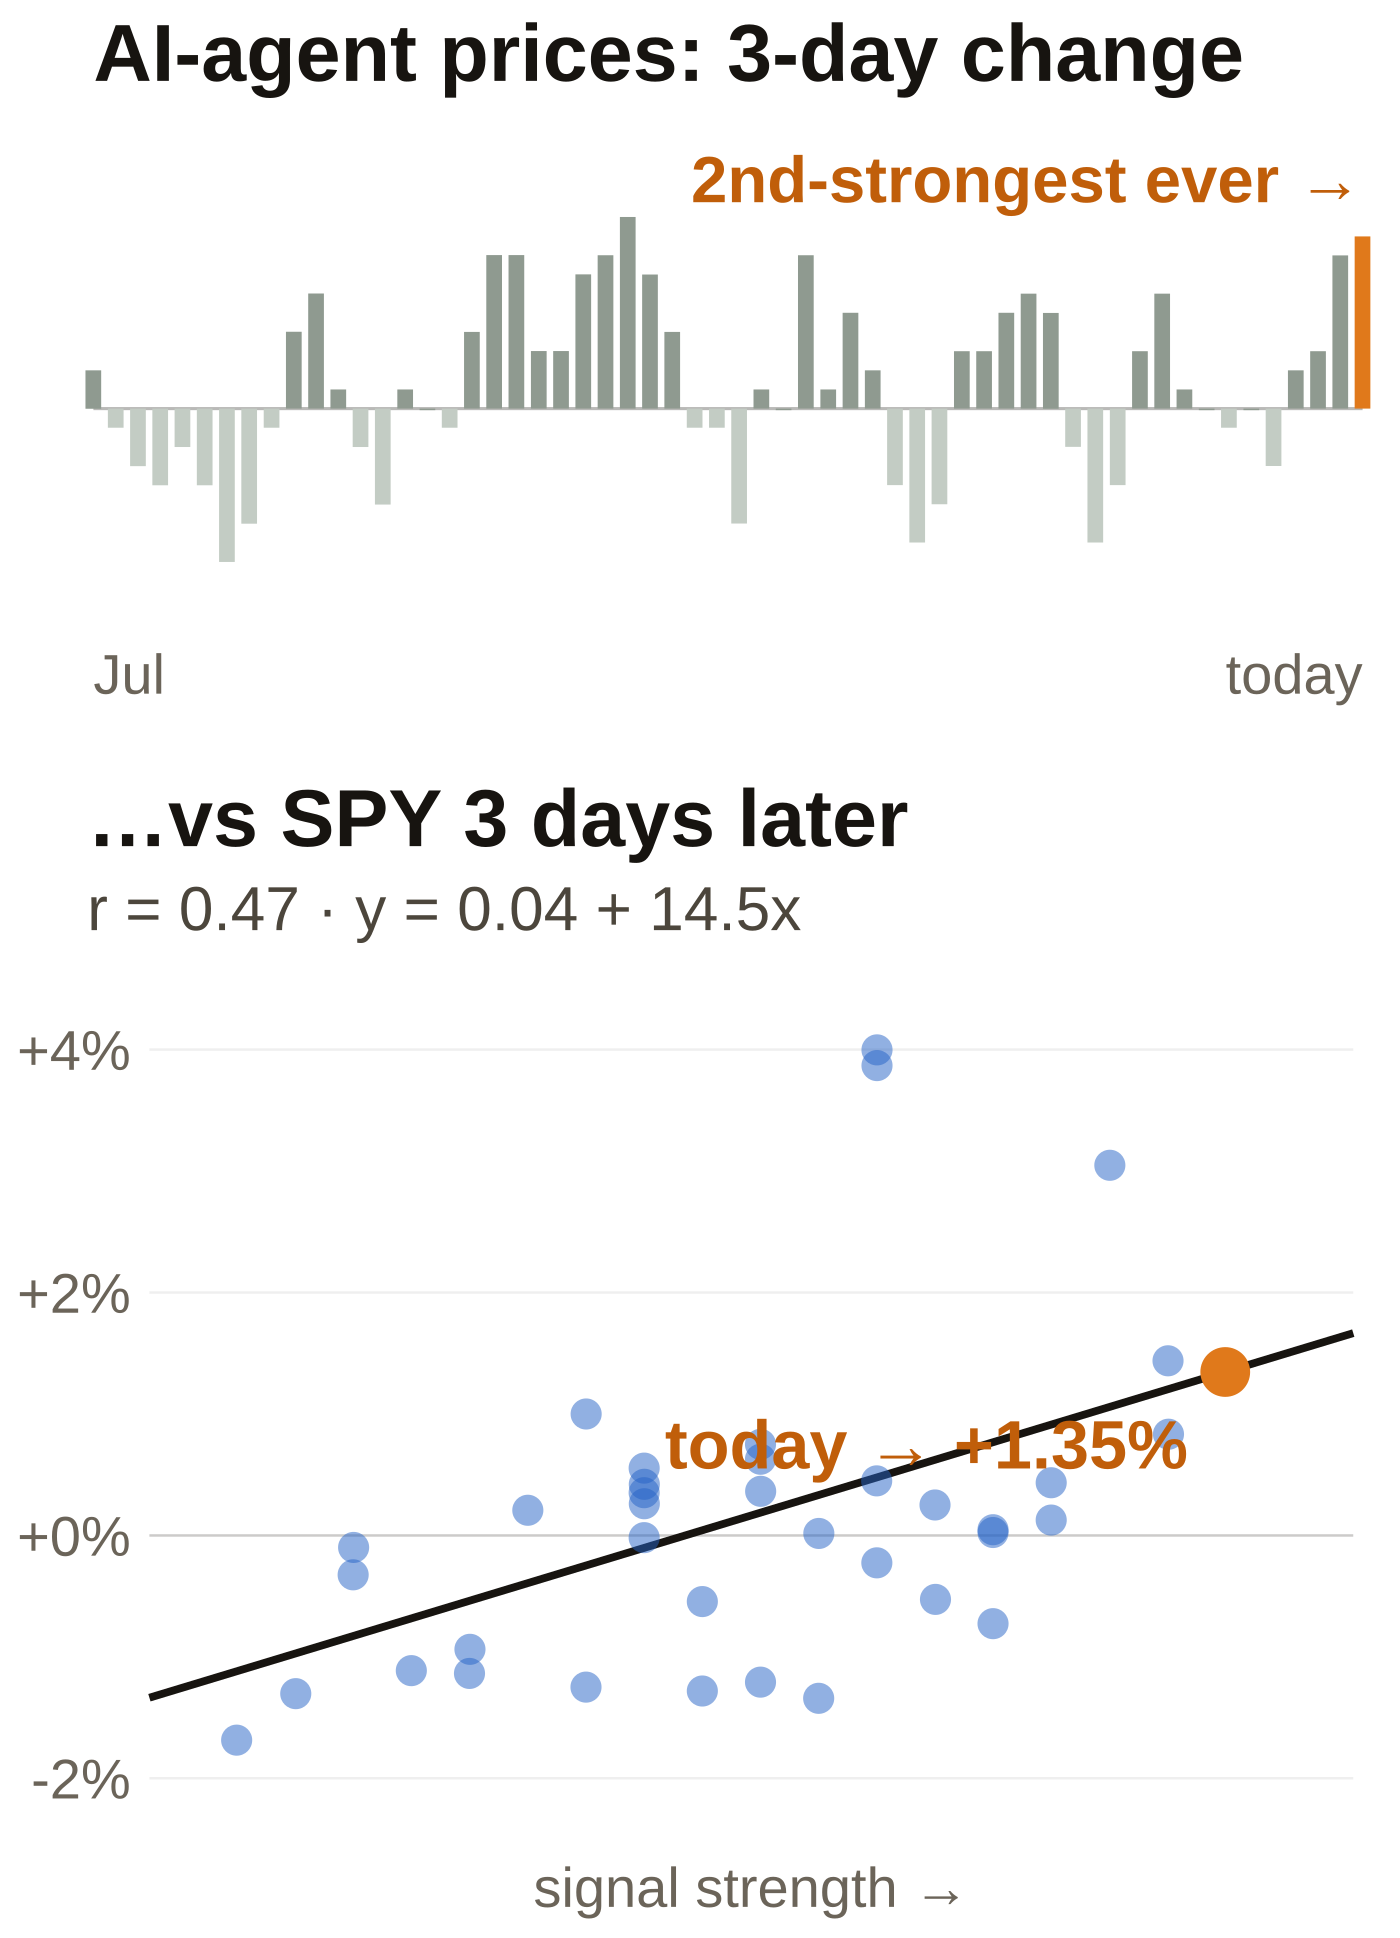
If the relationship holds, the next few trading days should see an outsized move in equities — and the correlation says the lean is upward. That is a big “if”, and we’re going to treat it the way the research note demands: as a live, falsifiable test, not a forecast to trade on.
The relationship, re-fitted on fresh data
We didn’t just cite the note — we re-ran the whole regression today with a week of new market data added (equity closes through 2 September). The relationship did not decay out of sample; it strengthened with horizon: r = 0.42 at one day, 0.47 at three, 0.51 at five. The fitted line for the headline pairing is
SPY (next 3 trading days) = 0.04 + 14.5 × AEPI 3-day signal
Plugging today’s +0.09% signal into the fitted equations gives the mechanical implication — SPY +1.35% over the three trading days after the gap (roughly Monday to Wednesday’s closes), +2.0% over five, and for the AI basket AIQ, whose slope is 2–3× steeper, +2.7% and +4.1%. At SPY’s recent volatility a +1.35% three-day move is close to a two-sigma event: the regression genuinely implies an outsized move, not a rounding error. Precedent points the same way — the three strongest signal days on record (27, 30, 31 July) were followed by SPY gains of +4.1%, +3.5% and +2.0% over five days, while the weakest signals were all followed by declines.
Read this before anything else: the correlation comes from nine weeks of data — exploratory, hypothesis-generating, and the signal windows overlap, so the effective sample is closer to a dozen independent observations than the 37 plotted. Every 95% prediction interval still includes negative outcomes (the 3-day SPY interval is −1.1% to +3.8%). This is not investment advice and no position should be taken on it. What it IS is a clean out-of-sample moment: the signal fired at nearly full strength today, in public, timestamped, with the implied numbers stated in advance. We will grade the outcome here on the blog either way — that’s the whole point of publishing it before we know the answer.
What’s underneath the move
Mechanically, today continues the pattern of the last month: enterprise and team plans repricing upward while individual tiers grind slowly and the platform layer discounts. The pace is glacial by equity standards — the whole two-month history spans less than half a percent — which is precisely why simultaneous records across three independently-chained series are worth noticing. In a market where almost nothing moves, everything moving up at once is information.
All series live at agentery.com/aepi — including the category table with every slice’s 24h/7d/30d/60d — and over MCP via get_price_index_history.