Research update, 14 October 2026. This is an exploratory analysis that generates hypotheses. It is not investment advice. The AEPI is a chained index of observed list prices. It is not a market price or a tradeable asset.
Does the AEPI lead equity markets? An October update
Agentery research · 14 October 2026 · Data: AEPI 6 July – 14 October 2026; ETF daily prices to the 13 October close
Key findings
- The claim about the S&P 500 did not hold up. We tested the original study's SPY design on signals after its 30 August publication. The pre-registered primary test came out at r = +0.08 on today's index and +0.02 on the index as it was actually published each morning. On 3 September we published a forecast of SPY +1.35% over the next three trading days. SPY fell 1.60%.
- Index revisions removed about a third of the original effect. On the study's own frozen data the result reproduces: SPY at three days, r = 0.64. On today's revised index history for the same days it is r = 0.40. Since early September the signal as published and the same signal after revision correlate only 0.71. Any study on a revised history overstates what was knowable at the time.
- Over the full sample there is a pattern beyond chance, and it points at growth and AI stocks, not the market. Across 450 tests of the AEPI against growth/AI ETFs, the average correlation with returns over the next 3–10 days is +0.20. Random re-timings of the AEPI average −0.02 (p ≤ 0.012). Tech minus SPY is positive (p ≤ 0.012), and defensive sectors are negative (p = 0.024).
- No single setting survives a correction for the search. The broad pattern is the finding. The "best" window, horizon or ETF is not.
- The effect is slow and comes from price cuts. AEPI changes over 3–10 trading days relate to equity returns over the following 3–10 days. One-day moves relate to nothing. Most of the effect comes from the subscription component and from price cuts. Currency conversion plays no part.
- The relationship runs both ways. After a weak week for the S&P 500, agent prices tend to rise over the following week (r = −0.45, p ≤ 0.012).
- Next step. We are pre-registering one primary test and five secondary tests, run on point-in-time data from 15 October. Results will be reported at 40, 80 and 120 trading days, whatever they show.
1. Why an update
The 30 August study reported that the AEPI's three-calendar-day change was associated with SPY and AIQ returns over the next few trading days. The design left a full trading day between the signal and the outcome. Six weeks of new data are now in, and the index history has since been revised. This update does four things:
- it grades the study's pre-registered out-of-sample test;
- it fixes the timing design;
- it re-runs a much wider search across the full sample, under a strict null;
- it freezes the next round of tests.
2. Timing: the gap and the weekend
Each day's AEPI is published between about 04:30 and 07:45 UTC. That is 6–9 hours before the US open at 13:30 UTC. Entering at the same day's open is therefore already free of look-ahead, and the original one-day gap was unnecessary. As a check, the return from the previous close to the same day's close (which straddles publication) shows no relationship with the signal (r = 0.01). So there is no same-day co-movement for a gap to guard against.
The AEPI is published seven days a week, but equities trade five. We compared windows measured in calendar days with windows measured in trading days. In a trading-day window, Saturday's and Sunday's price changes fold into Monday's reading. Trading-day windows line up with the equity clock and gave consistently stronger results. A Tuesday "three calendar days" window, for example, starts on a Saturday. Weekend scans carry the most AEPI movement. Monday signals by themselves predicted nothing in the 13 Mondays available.
3. Out-of-sample grade of the August study
We used signals after 30 August, the study's design (three calendar days, one-day gap) and SPY returns.
| Test | Today's index | As published (point-in-time) |
|---|---|---|
| Primary: SPY, t+1 close → t+2 close | r = +0.08 (n 29) | r = +0.02 (n 24) |
| Secondary: SPY, +3 days | −0.07 | +0.09 |
| Secondary: SPY, +5 days | −0.22 | −0.04 |
The 3 September forecast against what happened, measured from the 4 September close:
| +1 day | +3 days | +5 days | |
|---|---|---|---|
| SPY forecast | +0.65% | +1.35% | +2.01% |
| SPY actual | −0.55% | −1.60% | −1.21% |
| AIQ forecast | +1.67% | +2.66% | +4.13% |
| AIQ actual | 0.00% | −1.93% | −1.32% |
We regard the SPY claim as not supported, and we will not repeat it.
4. Full-sample discovery run
4.1 Method
We treated all data from 6 July to 13 October as one in-sample period and searched widely. The search covered:
- 9 AEPI signals: the headline, real repricings, currency-only moves, price rises, price cuts, late-detected changes, and the subscription, MCP and agent slices;
- 5 windows of 1, 2, 3, 5 and 10 trading days;
- 19 targets: SPY, AIQ, QQQ, SMH, SKYY, IGV, XLK, BOTZ, ARKK, IWM, XLU, XLP, TLT and GLD, plus five AI/tech-minus-SPY spreads;
- 2 entry points: the same day's open or its close;
- 5 horizons of 1, 2, 3, 5 and 10 trading days.
That is 8,360 regressions in total. With this little data and overlapping windows, the usual overlap-corrected t-statistics are badly inflated, so we did not rely on them. Instead, every result is compared against a null: we shifted the whole AEPI calendar by each offset from 10 to 91 days and re-ran everything. This keeps each series' own behaviour and destroys only the timing between them. With 82 shifts, the smallest p-value the test can show is about 0.012.
4.2 Is there anything beyond chance?
| Family (one number each) | Observed | Null mean (sd) | p |
|---|---|---|---|
| AEPI → growth/AI ETFs and SPY, mean r | +0.203 | −0.017 (0.088) | ≤ 0.012 |
| AEPI → AI/tech minus SPY, mean r | +0.197 | −0.015 (0.063) | ≤ 0.012 |
| AEPI → defensives (XLU, XLP), mean r | −0.152 | +0.021 (0.081) | 0.024 |
| Growth minus defensives | +0.355 | −0.038 (0.137) | ≤ 0.012 |
The strongest individual results did not survive a correction for searching the whole grid (best family-wise p = 0.45). We therefore report the pattern, not a best setting.
4.3 The shape of the pattern
By target. The table shows correlations of the three-trading-day AEPI change with returns from the close over the next three days.
| AIQ | XLK | QQQ | SKYY | BOTZ | IGV | SPY | SMH | ARKK | IWM | GLD | TLT | XLP | XLU |
|---|---|---|---|---|---|---|---|---|---|---|---|---|---|
| 0.43 | 0.40 | 0.39 | 0.39 | 0.35 | 0.34 | 0.32 | 0.29 | 0.28 | 0.08 | 0.05 | 0.02 | −0.17 | −0.26 |
AI and tech are highest, then the broad market. Small caps, bonds and gold sit at about zero, and defensives are negative. This fits a link to risk-on, growth-led markets more than to the market as a whole.
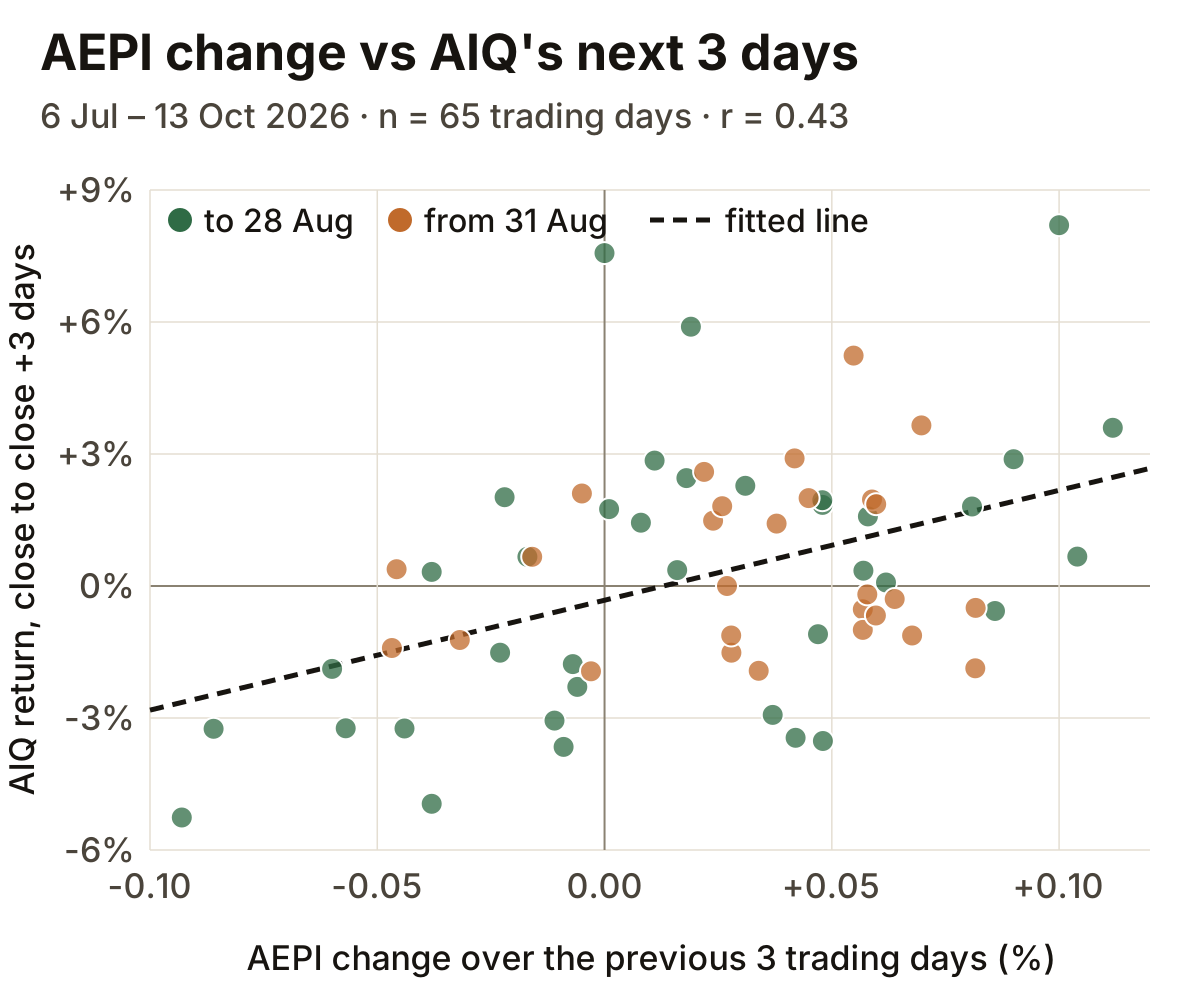
By component. The subscription slice (r = 0.47 with AIQ) and price cuts (0.35) carry the effect. Price rises carry little (0.17), and currency-only moves carry none (−0.01). Price cuts also show the clearest mirror image in defensives: XLU −0.45, XLP −0.43.
By timing. AEPI windows of 3–10 trading days and equity horizons of 3–10 days work. One-day AEPI changes and next-day returns show nothing.
Asymmetry. The table covers days when the three-day AEPI change exceeded ±0.05 points, with returns from the close over the next three days.
| After rises (21 days) | After falls (4 days) | All days | |
|---|---|---|---|
| AIQ | +1.20% | −3.41% | +0.27% |
| QQQ | +0.92% | −2.06% | +0.20% |
| SPY | +0.51% | −0.80% | +0.18% |
| AIQ minus SPY | +0.69% | −2.60% | +0.09% |
These 25 days come from only 11 separate episodes. The falls cover just two of them, in mid-July and mid-August, so treat this table as illustrative.
4.4 Robustness
- No single vendor drives it. No provider accounts for more than 2.2% of all repricing. Dropping any one of the 15 largest leaves the AIQ correlation between 0.37 and 0.46 (full sample 0.43).
- It survives controls. We added each ETF's own past three-day return and the changes in VIX, the dollar index and the 10-year yield. The AEPI coefficient stays positive and beats every shifted-calendar null (AIQ t = 3.2; SPY t = 2.7).
- But it is concentrated in July and August. After 30 August the SPY relationship is about zero and AIQ is weaker. On the index as published each morning (available from 8 September, about 25 observations), nothing is significant.
5. The reverse direction
Do equities lead the AEPI? A weak S&P 500 over five trading days is followed by a rising AEPI over the next week (r = −0.45, p ≤ 0.012). Over three days the figures are −0.34 (p = 0.012). The effect sits in real repricings, both more rises and fewer cuts. It is not currency conversion, and it is weak for AI equities (AIQ −0.13).
The data therefore suggests a loop. A weak market is followed by firmer agent prices, and firmer agent prices are followed by stronger growth stocks. The forward link survives controlling for the market's own past move, so it is not simply the reverse link seen backwards. A common driver could produce both, for example AI news that reaches stock prices first and vendor pricing pages later. Three months of data cannot tell these explanations apart.
6. Pre-registered tests from 15 October 2026
Data rules.
- We use only the index as published before 13:30 UTC on each trading day. The signal is the change over the last 3 or 5 trading days, with weekend changes folded into Monday. A day with no release before the open is skipped.
- Returns run from the adjusted close to the close 3 or 5 trading days later.
- Signal values and closing prices are stored when they are first seen and never restated.
Primary test. The growth-minus-defensives spread. This is the mean correlation over SPY, AIQ, QQQ, SMH, SKYY, IGV, XLK, BOTZ and ARKK (windows 3 and 5, horizons 3 and 5), minus the same for XLU and XLP. The hypothesis is that the spread is above zero. It was +0.36 in-sample. It is judged against shifted-calendar nulls of the out-of-sample data.
Secondary tests (Holm-corrected):
- Three-day signal → AIQ over the next three days, r > 0 (in-sample 0.43).
- Three-day signal → AIQ minus SPY, r > 0 (0.42).
- Price-cut component → defensives, r < 0 (about −0.44).
- After falls below −0.05 points, AIQ's three-day return is below its average.
- Reverse direction: SPY's five-day return → AEPI over the next seven days, r < 0 (−0.45).
Controls reported every time.
- IWM, TLT and GLD, which we expect to show no relationship.
- The currency-only component, which we expect to show nothing.
- The original SPY design, kept on record to close the August claim formally.
When. We will report at 40, 80 and 120 out-of-sample trading days, around mid-December 2026, mid-February 2027 and early April 2027. The primary test must reach p < 0.005, < 0.015 and < 0.045 at those three looks respectively. We will publish every look in full, including failures.
What would change our view.
- If the primary test fails, the summer pattern was an artefact, and we will stop presenting the AEPI as a market signal.
- If the primary test passes but tests 1–2 fail, the AEPI tracks broad risk appetite rather than AI specifically.
- If only test 5 passes, agent prices follow markets rather than lead them.
7. Limitations
- The sample is short: about 68 trading days, one market regime, no shock.
- Overlapping windows leave only about 10–20 independent observations at a three-day horizon.
- The search was wide (8,360 regressions). Individual results should be read as leads, not findings.
- The full-sample results use today's revised index history. Only the point-in-time tests are free of revision bias.
- None of these associations is a net trading return. They ignore costs, and they are not established alpha.
Data: AEPI daily releases and their listing-level price changes (aggregated; no listing-level data is published). ETF prices are Yahoo Finance daily opens and adjusted closes. The analysis code is plain Node.js with no fitted models beyond least squares.