This study replaces our earlier AEPI and equity research. The 30 August study and the 14 October update used an earlier AEPI calculation that was later found to be incorrect. Both are withdrawn. Their pages stay online for the record only.
Research note, 25 October 2026. Exploratory analysis, not investment advice. The AEPI is a chained index of observed list prices. It is not a market price or a tradeable asset.
AEPI and equity markets, re-run on the corrected index
Study 02 · 25 October 2026 · AEPI v3 (methodology v3-spec-1.4.1, release 134), 30 June – 25 October 2026 · ETF daily prices to the 23 October close
Key findings
- On the corrected index, AEPI changes do not predict equity returns. No ETF, window or horizon shows a relationship beyond what random timing produces.
- None of the earlier findings reproduce. The August SPY result (r = +0.50) is −0.04 over the same weeks. The October AIQ lead (r = +0.43) is −0.04. The October primary measure, growth minus defensive ETFs (+0.67), is −0.06.
- The reverse link is gone too. A weak S&P 500 week is no longer followed by rising agent prices (r = −0.15, p = 0.58; it was −0.45).
- The earlier patterns depended on the old calculation. The corrected index counts only confirmed price changes. It moves on 77 of 116 days, and its 3-day changes correlate only 0.38 with the withdrawn series.
- We will keep testing forward. The same tests now run each trading day on the corrected index as published, from 26 October 2026. Reviews come at 40, 80 and 120 trading days, whatever they show.
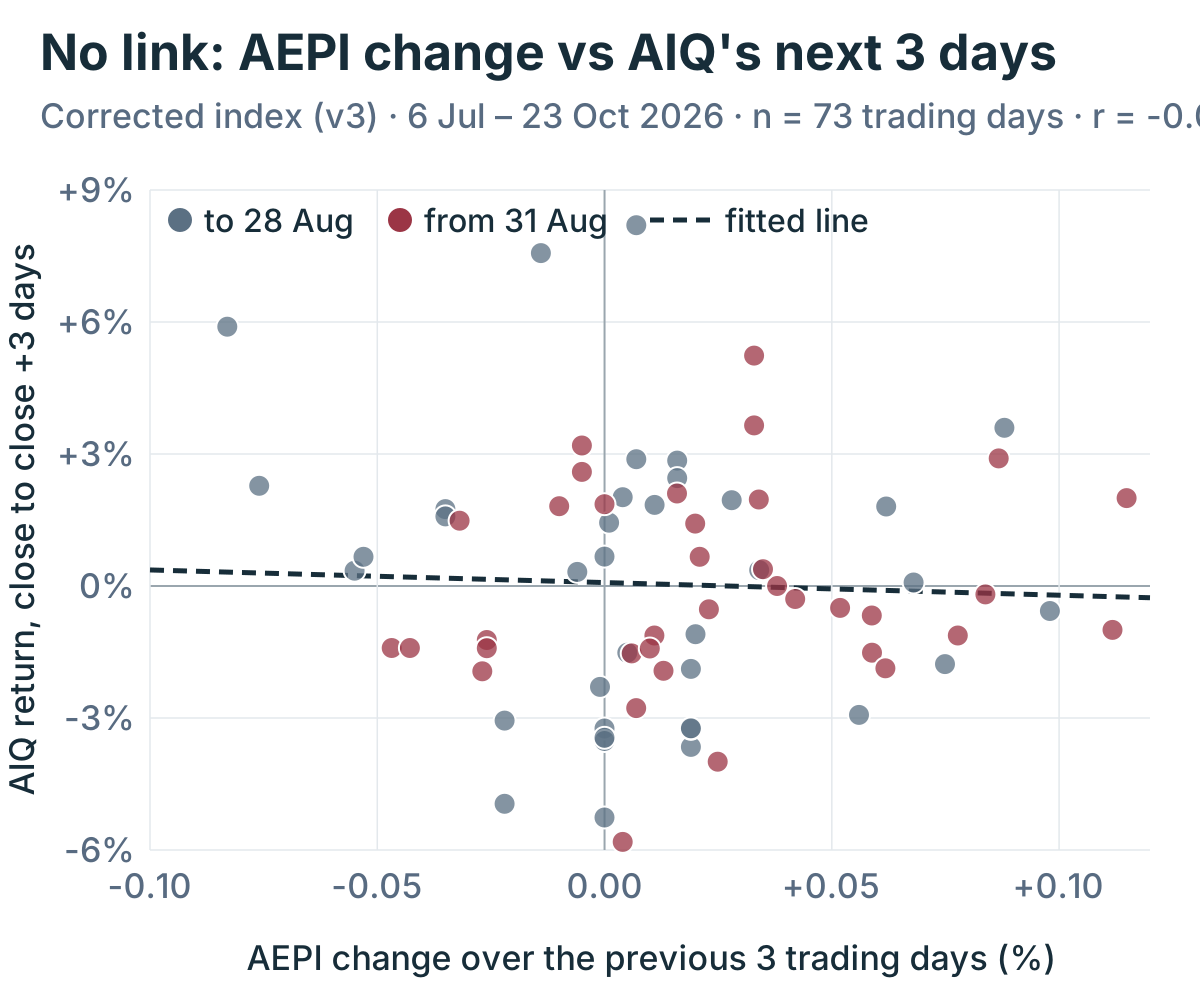
The October update's strongest relationship, redrawn on the corrected index. Each dot is one trading day. Grey dots are the original study's weeks; red dots come after them.
1. Why the earlier research is withdrawn
On 24 October 2026 the AEPI moved to a new calculation, aepi-ledger-v3. Under it, a price change counts only when the same purchase on the same terms shows a different payable price, and the new price is seen again on a later capture. The whole history from 30 June was recalculated from the page captures and price extractions stored each night. Many day-to-day moves in the old calculation (v1 and v2) do not meet that standard. Our equity research was built on those moves, so it cannot stand. The methodology page describes the revision.
2. Data and method
- AEPI: release 134, published 25 October 2026. It holds 117 daily levels from 30 June (100.000) to 25 October (100.311). Behind it are 196 verified price changes (115 rises, 81 cuts) from 108 providers, on 77 days. The sum of those changes matches the published level.
- Equities: daily open and close prices (adjusted for dividends) for SPY, AIQ, QQQ, SMH, SKYY, IGV, XLK, BOTZ, ARKK and IWM. XLU and XLP serve as defensive comparisons, with TLT and GLD as placebos. VIX, the dollar index and the 10-year yield serve as controls.
- Sample: 6 July to 23 October 2026, 79 trading days. This is the same start date as the October update. Starting on 1 July instead changes nothing.
- Timing: each day's AEPI is published hours before the US open. A trading-day signal on day T uses AEPI levels up to T.
- Significance: each result is compared with the same test after shifting the AEPI calendar by every offset from 10 to 107 days (98 shifts). For the whole grid, the largest result is compared with the largest result under each shift.
3. The published claims, re-tested exactly
Each claim is re-run with its original design and no new choices.
| Claim | Earlier result | Corrected index | Shift p |
|---|---|---|---|
| August study: AEPI 3 calendar days → SPY +3 days after a one-day gap (to 28 Aug) | r = +0.50 | r = −0.04 (n 37) | 0.88 |
| Same design, AIQ +3 days (to 28 Aug) | r = +0.40 | r = +0.02 (n 37) | 0.98 |
| Same design, SPY +3 days, full sample | — | r = −0.11 (n 72) | 0.45 |
| October: 3 trading days → AIQ close +3 days | r = +0.43 | r = −0.04 (n 73) | 0.88 |
| October: 3 trading days → AIQ minus SPY +3 days | r = +0.42 | r = −0.03 (n 73) | 0.89 |
| October primary: growth minus defensives (mean r, 3/5-day windows and horizons) | +0.67 | −0.06 | 0.55 |
| October reverse: SPY past 5 days → AEPI next 7 days | r = −0.45 | r = −0.15 (n 74) | 0.58 |
| October direction rule: AIQ next day, signal > 0 vs ≤ 0 | +0.44 pp | +0.03 pp | — |
At other horizons, the August design gives correlations from −0.33 to +0.02, all negative or near zero. None is significant against the shift null.
4. The wider search, repeated
We repeated the October discovery run in full. It has 7 AEPI signals: the headline, agents, MCP servers, subscription, pay-as-you-go, rises only and cuts only. These cross 5 signal windows, 19 equity targets, 2 entry times and 5 horizons, for 6,650 regressions in total.
- 1,119 tests reach |t| ≥ 2. About 989 would by chance. The excess comes from two one-way series, pay-as-you-go (394 against 228 expected) and cuts only (191 against 115). The headline is below chance (116 against 124).
- The largest single result has a family-wise p of 0.55, so nothing survives the search.
- The family tests are all null. For the headline against growth/AI ETFs, mean r = −0.11 (p = 0.87). For AI/tech minus SPY, mean r = −0.08 (p = 0.77). For growth minus defensives, −0.02 (p = 0.53).
- Adding controls for the ETF's own past return, VIX, the dollar and the 10-year yield changes nothing. The AEPI coefficient on AIQ +3 days has t = −0.03.
- No single provider drives the result. Dropping any one of the 15 biggest movers keeps r between −0.12 and +0.05.
The one-way series are not evidence. Pay-as-you-go moved on only 9 days, all down. The cuts-only series can only fall. Each is close to a falling straight line, while tech ETFs mostly rose over the same months. Two trends running in opposite directions produce large negative correlations. None of them survives correction for the search (best family-wise p = 0.55).
5. Big moves
The 3-day headline change rose by more than 0.05 points on 15 days and fell by more than 0.05 on 4. The 15 rises were followed by AIQ returns close to average: −0.12% over 3 days, against +0.03% on all days. The 4 falls were followed by gains (+2.30%). That is the opposite of the old index, where falls came before sharp tech declines. Four events cannot support a conclusion either way.
6. What happens next
The live tracker on aepi.ai/research now reads each trading day's signal from the corrected index as it was published before the US open. It starts on 26 October 2026, with the in-sample comparison running 6 July to 23 October. Three tests are fixed now, before any forward data exists:
- Primary: growth minus defensive ETFs (mean r), 3 and 5-day windows and horizons.
- 3-day signal → AIQ over the next 3 days.
- 3-day signal → AIQ minus SPY over the next 3 days.
Given the in-sample result, our expectation is no effect. Results will be published at 40, 80 and 120 trading days, whatever they show.
7. Limitations
- 79 trading days is a short sample, and the windows overlap.
- The v3 history before 24 October is a rebuild from saved pages, not a point-in-time record. That does not help any of the earlier claims: on the rebuilt history they are null, and a rebuild can only add look-ahead, not remove it.
- On an average day, about 28% of the weight of comparable purchases cannot yet be compared, and it is excluded. Price-change accuracy has been reviewed by a model, not audited by a person.
Reproducibility
The script, inputs and full output are kept with the research archive (aepi-equity-v3-2026-10-25: study-v3.mjs, results.txt). The index history used here is available from the AEPI API at release 134. The withdrawn studies' frozen inputs are kept unchanged.